
Bottom’s in? Think Twice.

Dear subscribers,
Welcome to Bitcoin Onchain, Offchain, and Beyond.
In the last forecast (BTC price: $21k), I pointed out that bitcoin faced heavy selling pressure ahead. Since then, we dropped to the 18-19k zone and have been range bound in the 19-22k band. With continued gloomy macro conditions, the crypto market stays relatively the same compared to the last forecast.
Below is a summary for market conditions on July 15th 2022 (BTC current price: $21k):
Long term:
BTC will continue making all-time highs, but not this year.
Like the last forecast, institutional bearish sentiment continues. The activity from mega whales significantly decreased, which intensifies the liquidity issues. Long-term holders are still selling at losses. These generally mark the beginning of a prolonged bear market. Long-term on-chain metrics continue to be oversold. However, with BTC SPX correlation at all time high levels and inflation rising month after month, the lack of demand gives room to larger drawdowns compared to prior cycles.
Short term:
Bearish
Short-term sentiment remains in the bearish trend, and price is currently at short-term holder purchase price. The 19k to 22k run we’ve seen earlier this month was driven by retail derivative trading, but the retail derivative bulls are quickly fading (with yesterday closing at similar level compared to July 6th, Binance annualized daily basis decreased from 2.2% to 0.16%).
Stay safe.
Phi
Bitcoin Equity Correlation at All Time High
With Increased BTC SPX correlation, the impact of inflation on BTC prices increase accordingly.
Unfortunately, supply side shortages make it tough for the Fed to deal with the inflation issues at hand. So I wouldn’t be calling the bottom now even with lots of on-chain metrics at historical oversold levels.
Most crypto traders are more focused on the FOMC results rather than the inflation data, but in reality, inflation data is crucial for the FOMC decision. Below is the timeline for what happened in June for the May data release.
June 9th: 4% probability for 75bps rate hike; 96% probability for 50bps rate hike
June 10th: May CPI data released (actual > estimate by 0.3%)
June 10th – June 14th: probability for 75bps rate hike surged from 4% to 94%
June 15th: Fed raised rate by 75bps
The majority of the 30k to 20k BTC drop happened before the FOMC (June 14-15th) and after the CPI data release (June 10th).
Actual inflation has only gone below the estimated inflation rate once for the past 16 months. Once again, June inflation turned out to be 9.1% YOY, beating the estimated MOM rate by 0.2%. Few days before the June data release, the probability for 100bps rate hike was less than 10%, now the probability is at close to 50%. If we look at the differential between estimated and actual CPI data, it’s interesting to see that BTC has faced tough market conditions when the actual data beats the estimated inflation data. Unfortunately, another “orange circle” just got printed less than 48 hours ago.
Liquidity Exiting the Market
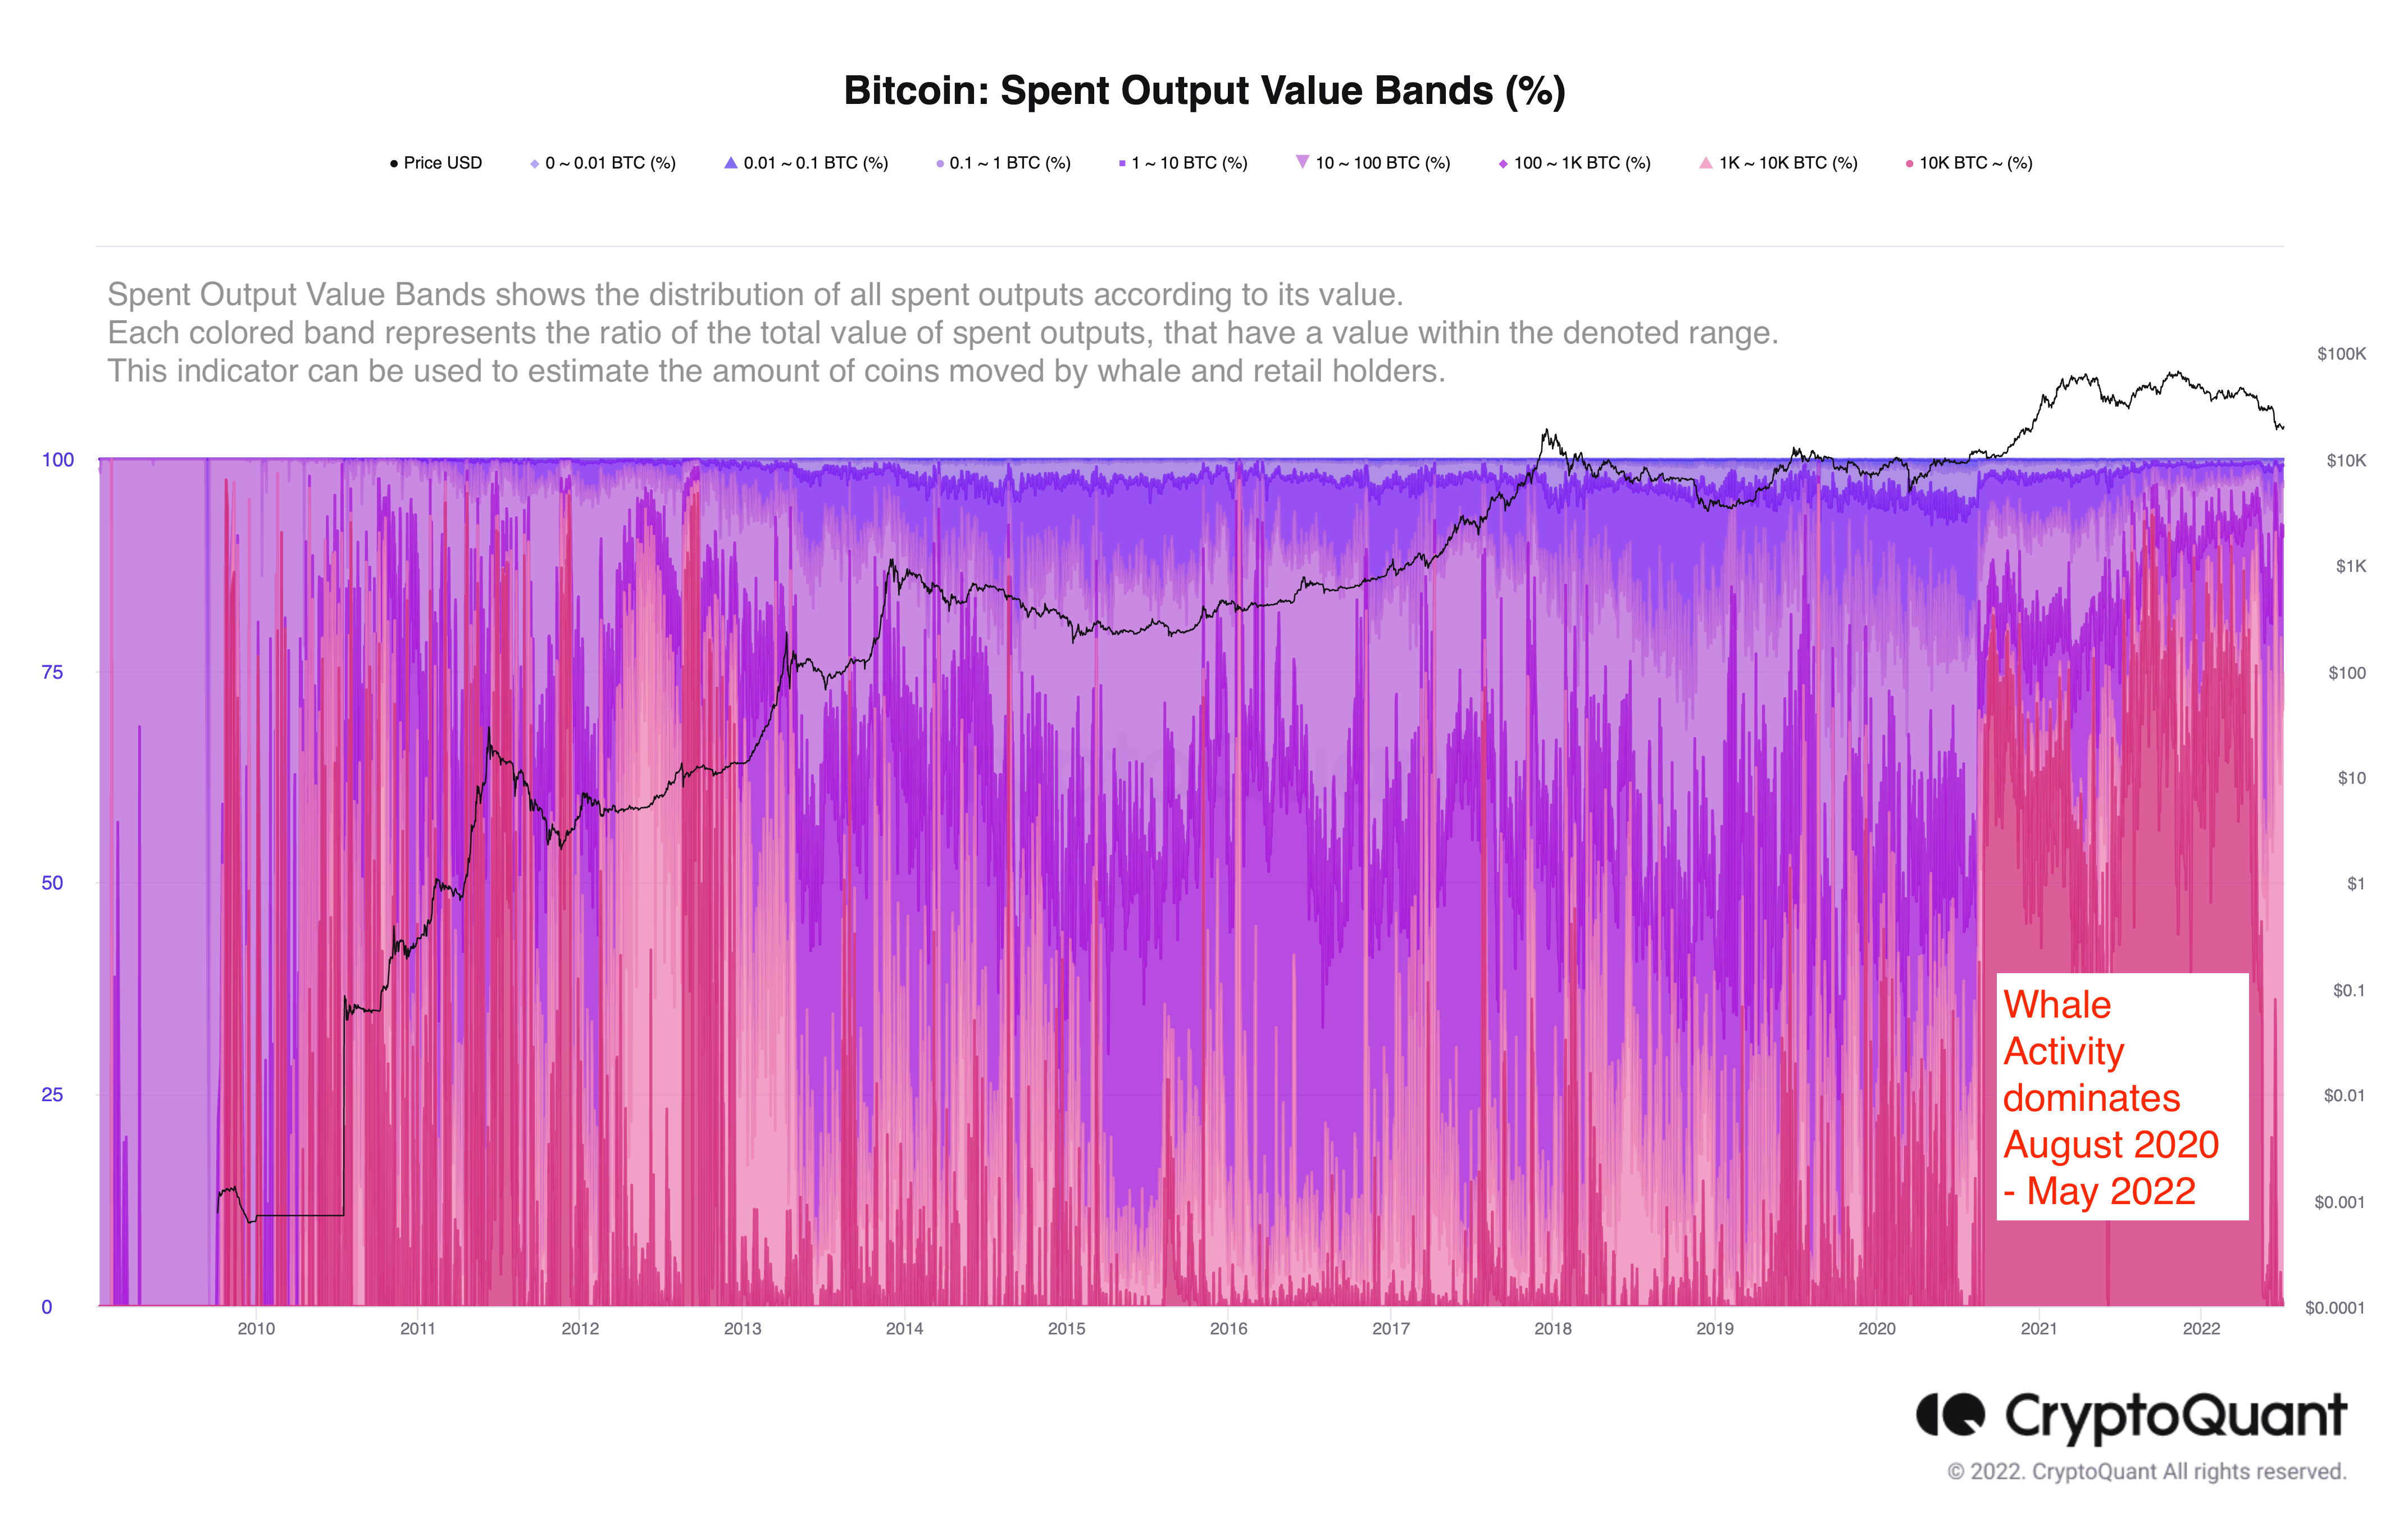
The chart above is the spent output value bands. From August 2020 to May 2022, daily Bitcoin on-chain activities were dominated by outputs holding 10k BTC or more. The activity from this cohort decreased to less than 10% lately. Similar to Three Arrows, lots of hedge funds are victims of the Luna event. For those institutions still in the game, gloomy market conditions also forced these participants to take more conservative stances compared to last year. As a result, it’s not a surprise to see addresses with 1k+ bitcoin on a continuous downtrend. Without healthy liquidity, the upside is extremely limited.
Long-term Holder Capitulation Continues
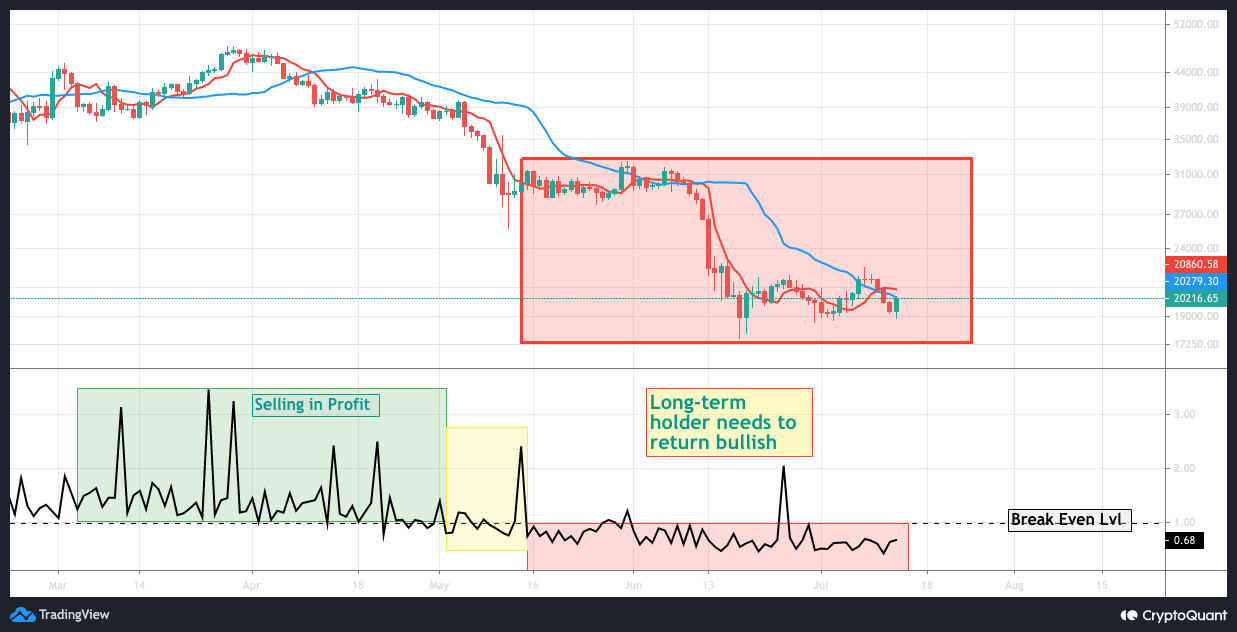
In the last forecast, we pointed out long-term holders have started their capitulation, which is extremely alarming as these historically marked prolonged bear markets. The capitulation continues, and long-term holder SOPR now hovers in the 0.5-0.8 range, indicating long-term holders are selling at 20-50% losses. The longer it takes on the downtrend, the longer it will take for the bottom to form. Being seasoned crypto participants, long-term holders will likely stop the capitulation at the beginning of the next bull run. In other words, there will be enough time for entry to ride the next bull wagon.
Short-term Sentiment Trend Still Bearish
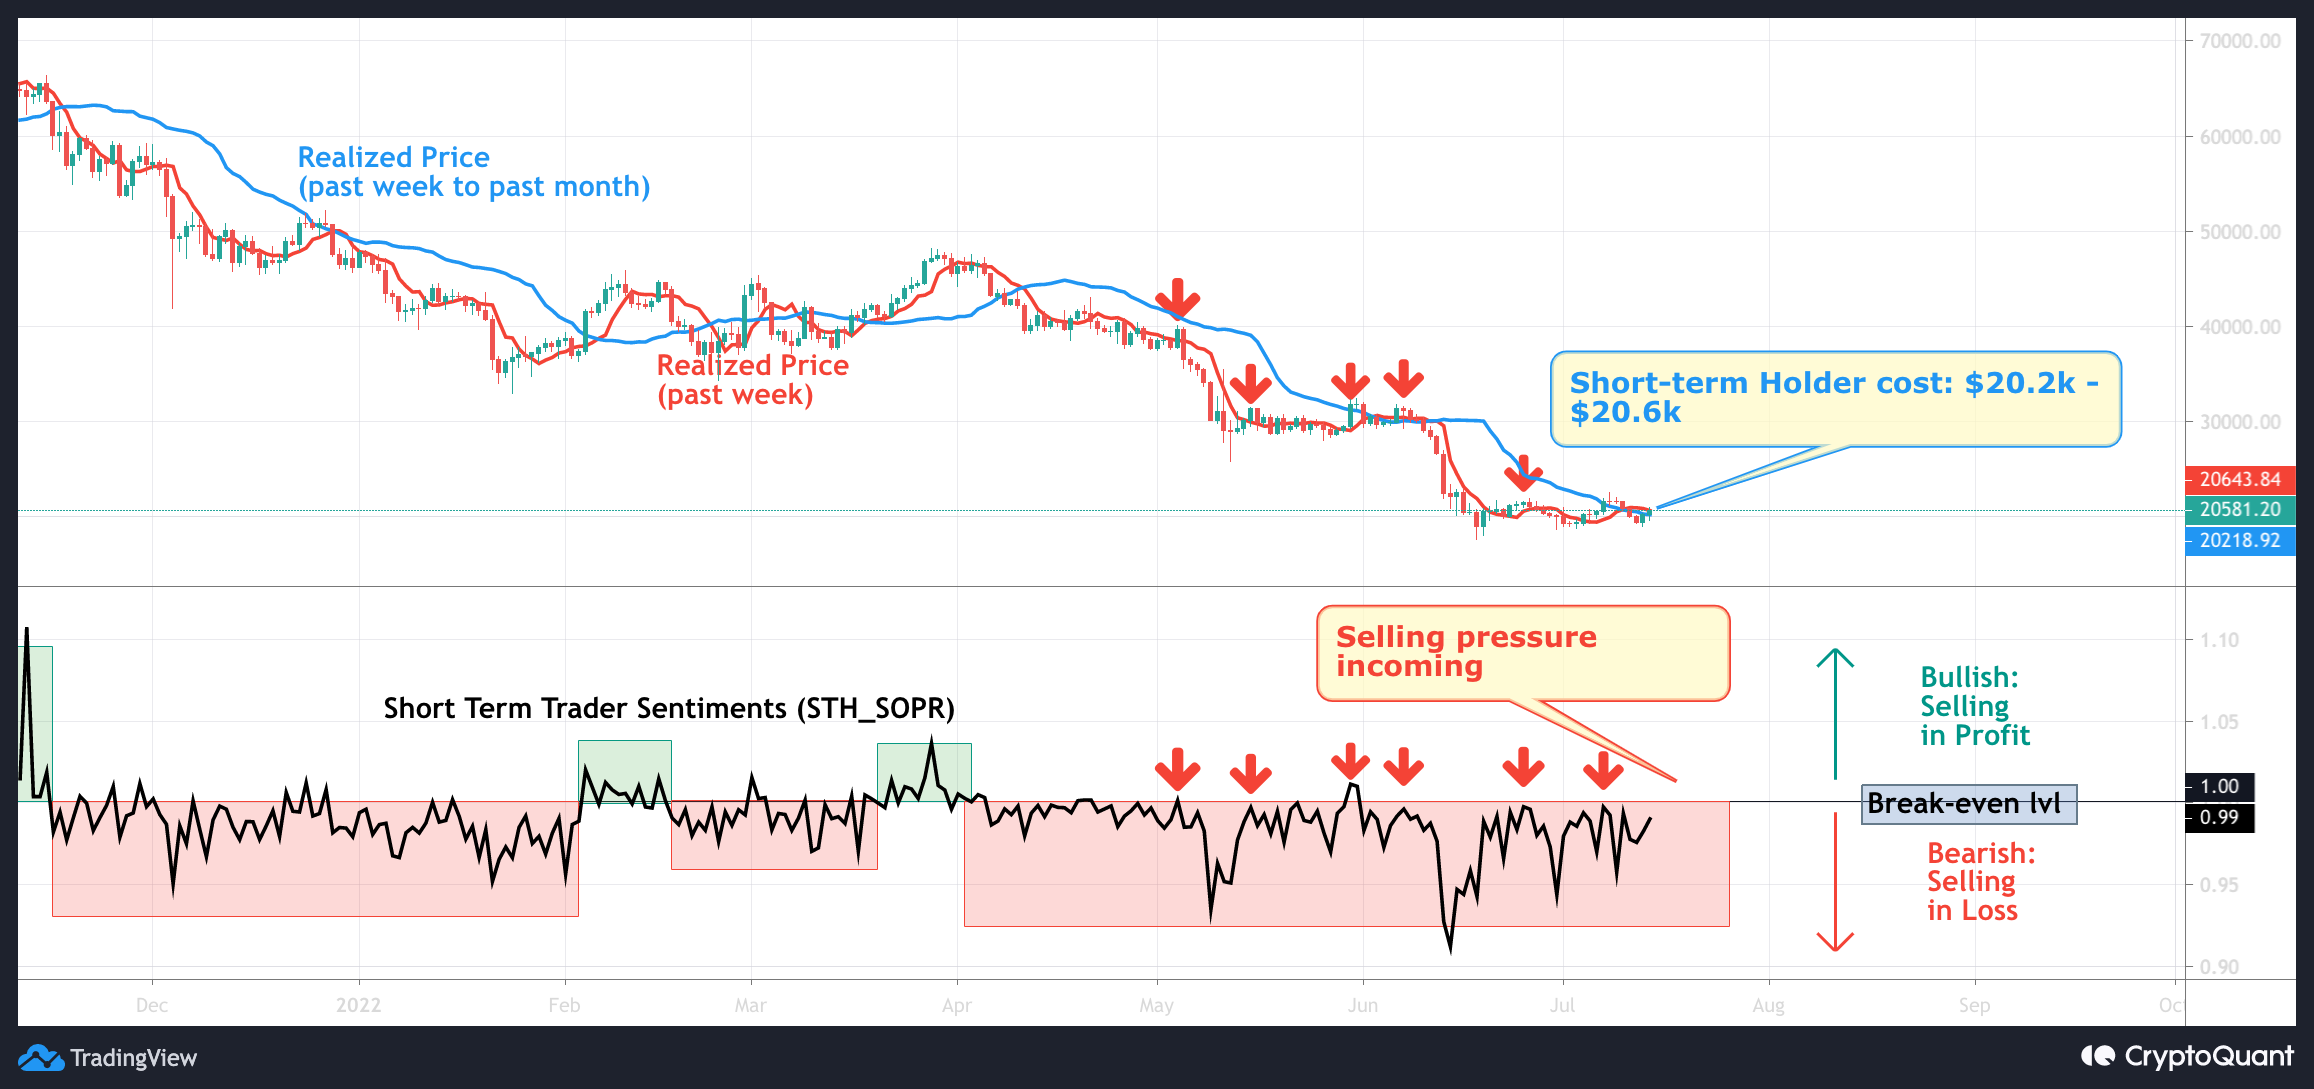
The indicator above is the short-term holder SOPR (above 1 – bullish: traders selling in profits; below 1 – bearish: traders selling in losses). And the red and blue lines on price are the average purchase prices for those who bought in the past week and the past month (excluding past week) respectively.
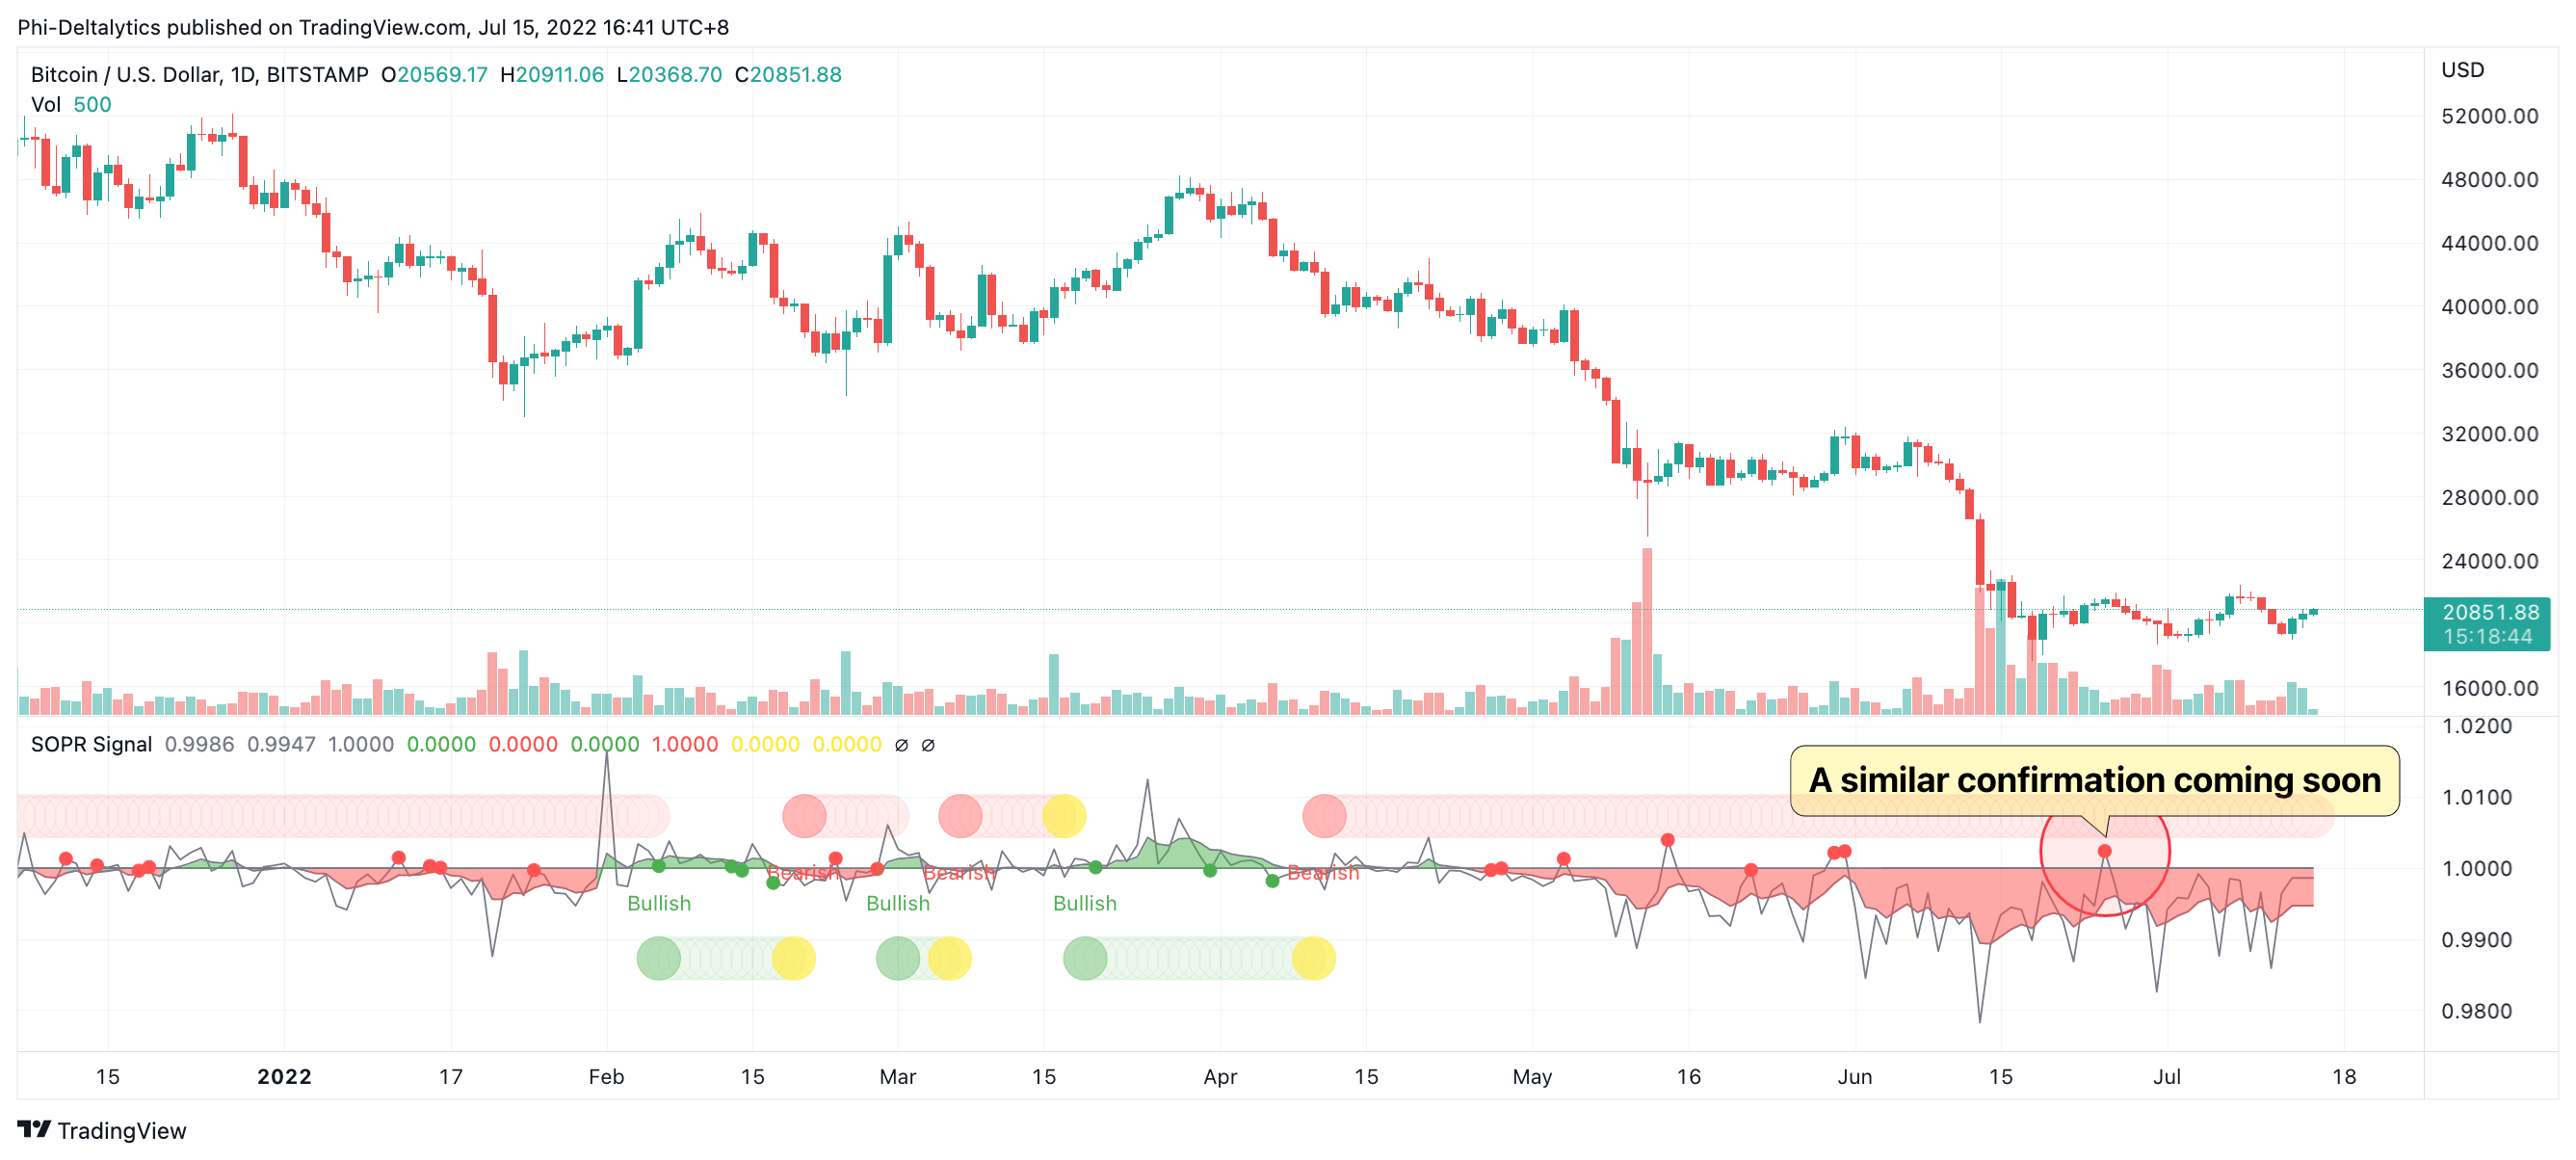
We are still in the short-term bearish sentiment trend, which means traders are going to sell when their break-even prices are hit (so most short-term holder SOPR rejections at 1 are correlated with local price tops). I would give it another day or two for this indicator to get close to 1. The current BTC price is already at the average cost for short-term holders. Once a similar confirmation in the chart below prints, I would likely start shorting (the indicator is linked at the bottom of this newsletter).
Futures Bulls on Shaky Ground
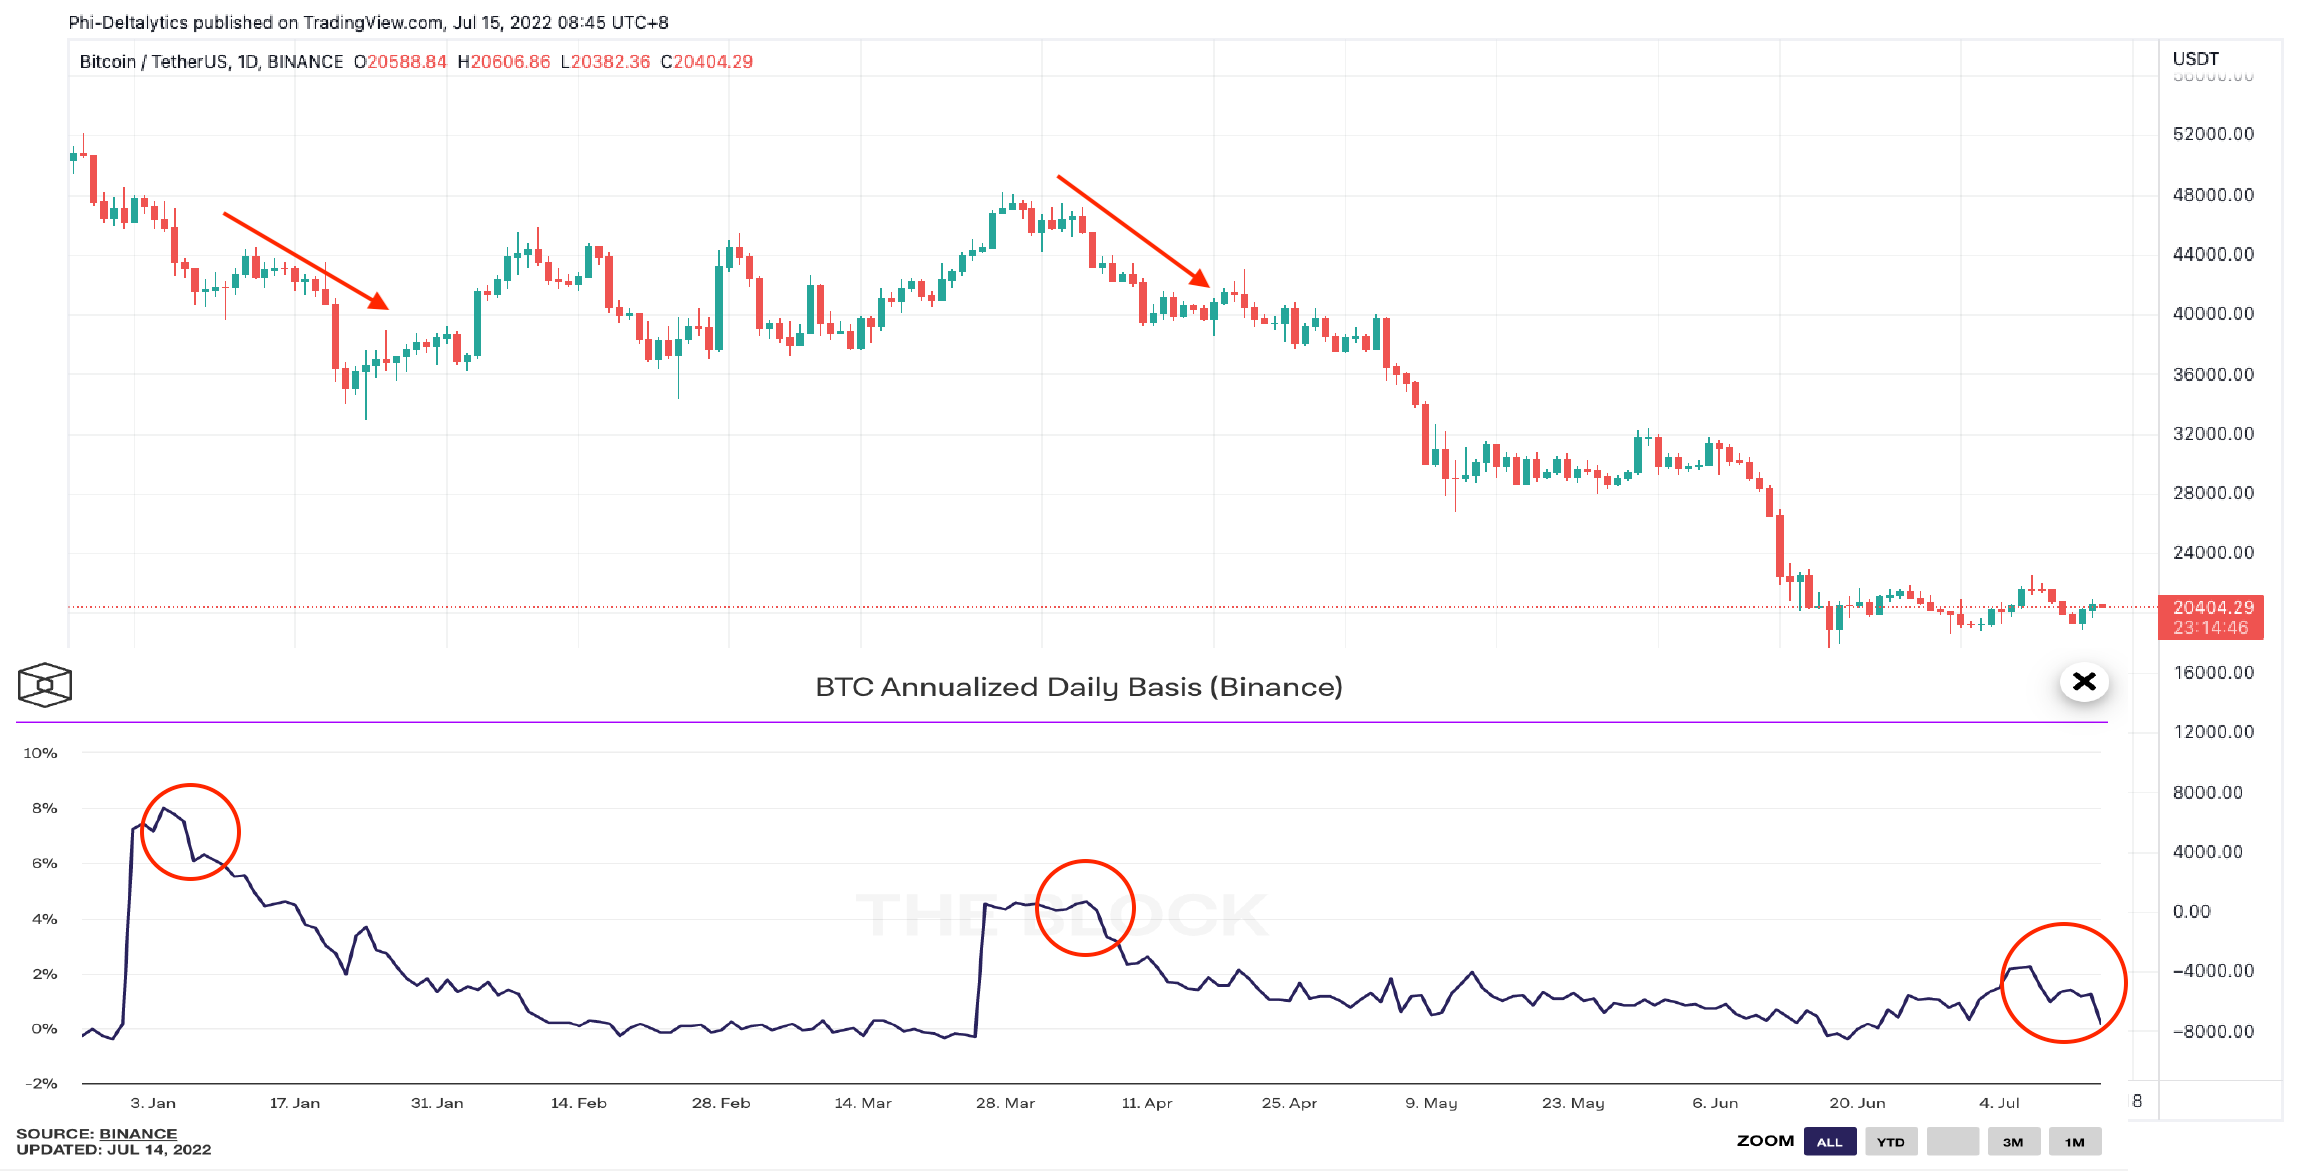
With futures volume still at 6-7 times of spot volume, the futures sentiment is crucial. While the futures basis up trending doesn’t necessarily mean an uptrend in price, a downtrend in futures basis is often linked to an increase in selling pressure. After all, low risk and profitable basis trades are much more attractive than trading in a bear market. Bitcoin closed yesterday at a similar level compared to that of July 6th. However, the Binance annualized daily basis decreased from 2.2% to 0.16%. Without a bullish sentiment mentioned in the sections above, I don’t think basis traders will give bitcoin too much breathing room before jumping on the sell side. The faith from futures bulls is also lacking.
Free On-chain/Fundamental Analysis Indicators:
Onchain Whale Demand:
https://www.tradingview.com/script/9Fhu9LGQ-BTC-Transaction-On-Chain-Volume-Basic/
Active Address Momentum:
https://www.tradingview.com/script/KI8h2N33-BTC-Active-Address-Momentum-On-chain/
Active Address Trend:
https://www.tradingview.com/script/Czkfui2v-BTC-Active-Address-Trend-On-chain/
SOPR Signal:
https://www.tradingview.com/script/nzuHp5az-SOPR-Signal/
Institutional Trader(Coinbase) Premium Indicator:
https://www.tradingview.com/script/jMnKn8Er-BTC-Coinbase-Premium-Trend/
Altcoin vs. BTC Season:
https://www.tradingview.com/script/95QlU7Uk-Altcoin-vs-BTC-Season/
Free Technical Analysis Indicators:
Auto MACD Divergences:
https://www.tradingview.com/script/NvtunxPO-MACD-w-Divergences/
Auto RSI Divergences:
https://www.tradingview.com/script/CuB4Dgs0-RSI-w-MAs-Divergences/
Disclaimer
NONE OF THE INFORMATION IS INTENDED AS INVESTMENT ADVICE, AS AN OFFER OR SOLICITATION OF AN OFFER TO BUY OR SELL, OR AS A RECOMMENDATION, ENDORSEMENT, OR SPONSORSHIP OF ANY SECURITY, GROUP, POOL, OR FUND. IT SHOULD NOT BE ASSUMED THAT THE METHODS, TECHNIQUES, OR INDICATORS PRESENTED IN THIS NEWSLETTER WILL BE PROFITABLE OR THAT THEY WILL NOT RESULT IN LOSSES. PAST RESULTS ARE NOT NECESSARILY INDICATIVE OF FUTURE RESULTS. THE CONTENT AND ANALYSIS IN THIS NEWSLETTER IS FOR EDUCATIONAL PURPOSES ONLY AND IS NOT INTENDED TO BE AND DOES NOT CONSTITUTE FINANCIAL ADVICE OR ANY OTHER ADVICE. THE INFORMATION PROVIDED IS GENERAL IN NATURE AND NOT SPECIFIC TO YOU. YOU ARE RESPONSIBLE FOR YOUR OWN INVESTMENT RESEARCH AND INVESTMENT DECISIONS.