


Don’t DCA Yet

Dear subscribers,
Welcome to Bitcoin Onchain, Offchain, and Beyond.
In the last forecast (BTC price: $30.2k), I pointed out crypto has entered its winter with institutional traders turning bearish first time since 2020 and price will likely revisit the wick low of 27k level. Since then, bitcoin plummeted to 2017 all time high levels and is finding temporary supports.
Below is a summary for market conditions on June 21th 2022 (BTC current price: $21k):
Long term:
BTC will continue making all-time highs, but not this year.
While bitcoin is now under its realized price, institutional bearish sentiment continues, and long-term holders are capitulating. These generally mark the beginning of a prolonged bear market. Under gloomy macro conditions, I would wait for clearer signs before starting to DCA.
Short term:
Bearish
As mentioned before, any uptrend could be split into the following 4 stages.
Stage1: Market oversold (Downward/flat trend)
Stage2: Existing participant sentiment becomes bullish (Chop)
Stage3: More demand kicks in (Bullish Trend)
Stage4: Market overheated
Unfortunately, I think Bitcoin is still in stage1. Short-term sentiment remains in the bearish trend, and price is approaching short-term holder’s break-even price. With many exchanges and funds still experiencing the after effects of UST de-pegging, I think bitcoin will face heavy selling pressure in the 21-24k range.
Stay safe.
Phi
Bitcoin in Gloomy Macro
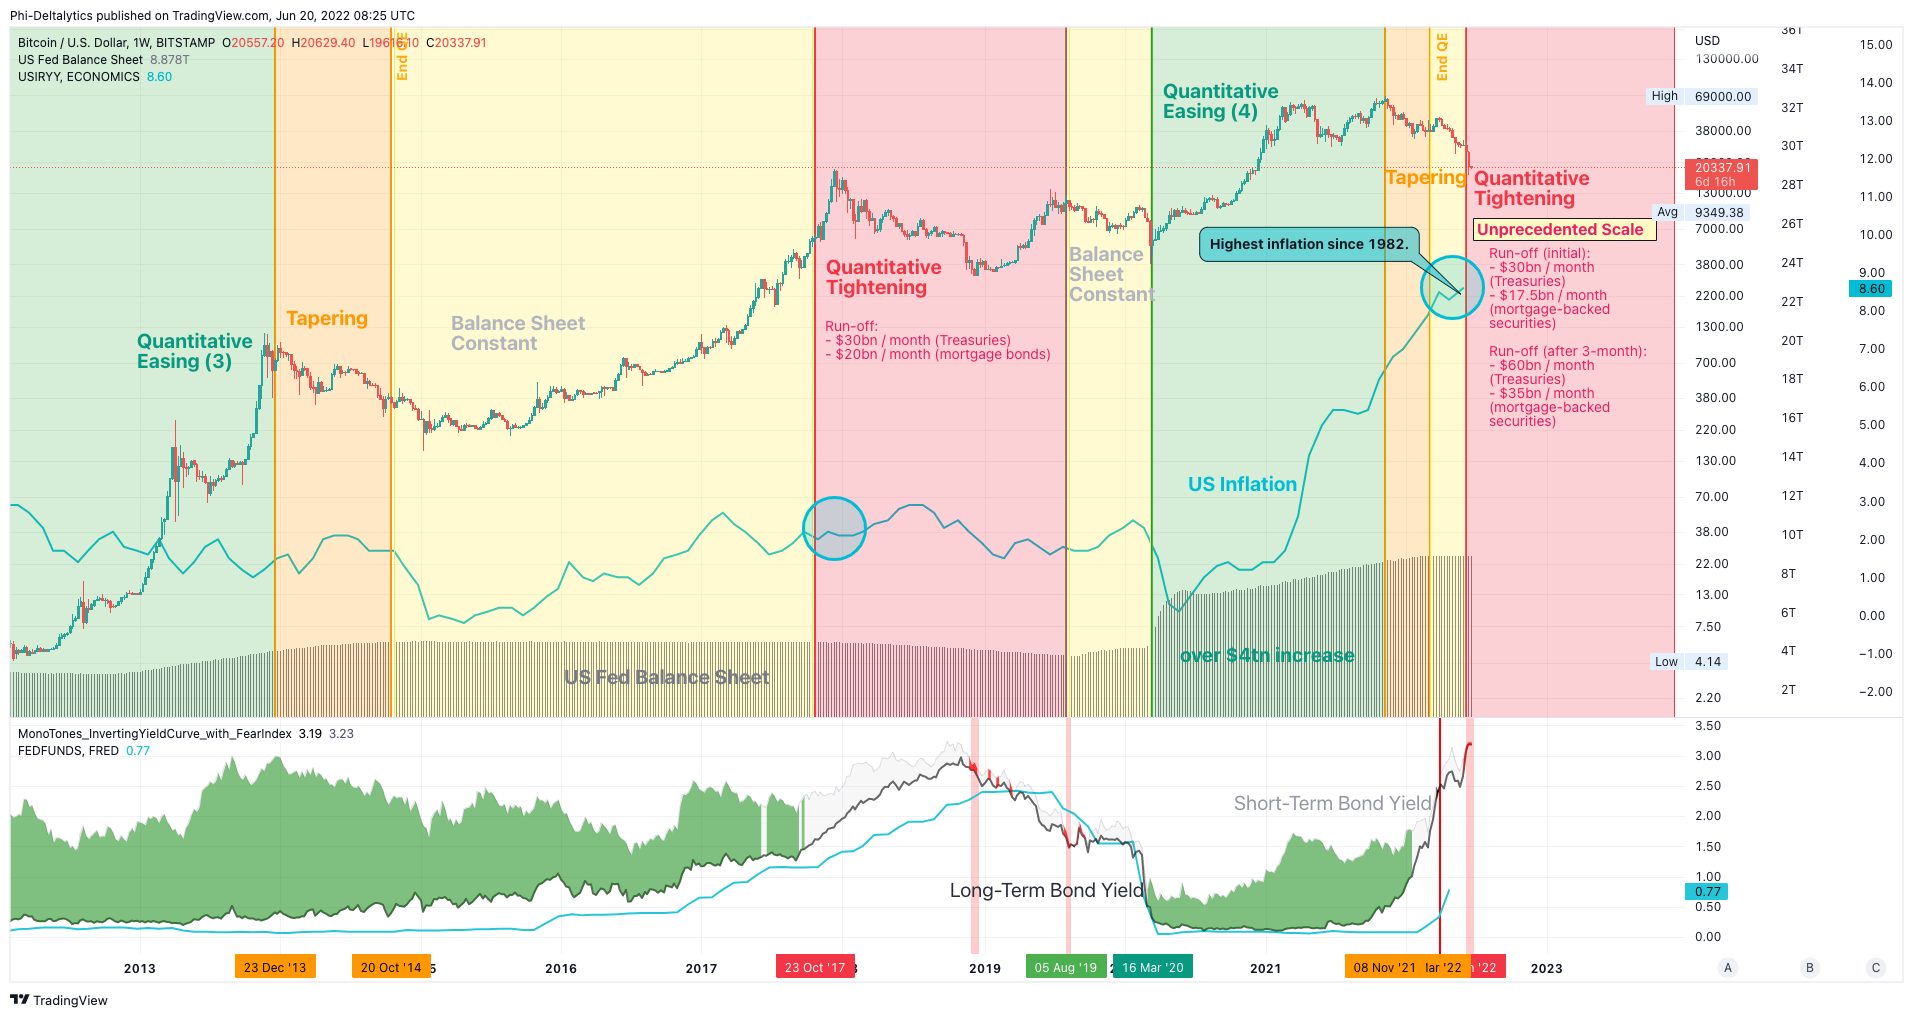
Macro conditions couldn’t be any worse. Starting this month, the Fed unleashed its quantitative tightening (QT) plans, trimming the $9trillion balance sheet at an unprecedented scale (current run-off cap: $47.5bn/month initial; $95bn/month 3 month later; 2017 run-off: max $50bn/month). The last two quantitative tightening led to a sharp rise in yields in 2013 and a repo crisis in 2019 respectively. Unfortunately, this time around, the Fed has to deal with a much larger balance sheet and all-time high inflation rate since 1982. Without the ability to print real world supply of goods and services (factories, natural resources), the Fed has lever on the demand side, but lowering demand means hikes in unemployment (which the Fed is already targeting). With a 7% gap between short-term rate and inflation rate, can the Fed “just rise unemployment a little bit” without causing a recession? The following newsletter by founder of Lyn Alden Investment Strategy offered an in-depth analysis into why the economy is on its path to recession: https://www.lynalden.com/june-2022-newsletter/.
For us crypto traders and investors, the question is - isn’t bitcoin an inflation hedge, and if global market enters a recession, wouldn’t bitcoin be the risk-off asset of choice? My take on this is not in this cycle. Bitcoin has not experienced a proper traditional finance bear market yet and has performed poorly during past tapering and quantitative tightening environments. In other words, bitcoin’s inflation hedge narrative hasn’t been officially tested or widely accepted. With arbitrage opportunities, scams, hack risks, and run-on-bank fear, the crypto market is no doubt in its early stage. While superior security and scarcity give bitcoin the potential to replace gold in a new era of currency, early-stage demand side volatility makes bitcoin subject to wild price swings. The current reality is we see rising correlation between bitcoin and the equity market year after year, and the volatility is further heightened by the derivative market. In the current cycle, bitcoin’s inflation hedge value is overpowered by its volatility, and it is hard for bitcoin to rally under gloomy global macro conditions before the market matures and stabilizes.
Long-term Holder Capitulation
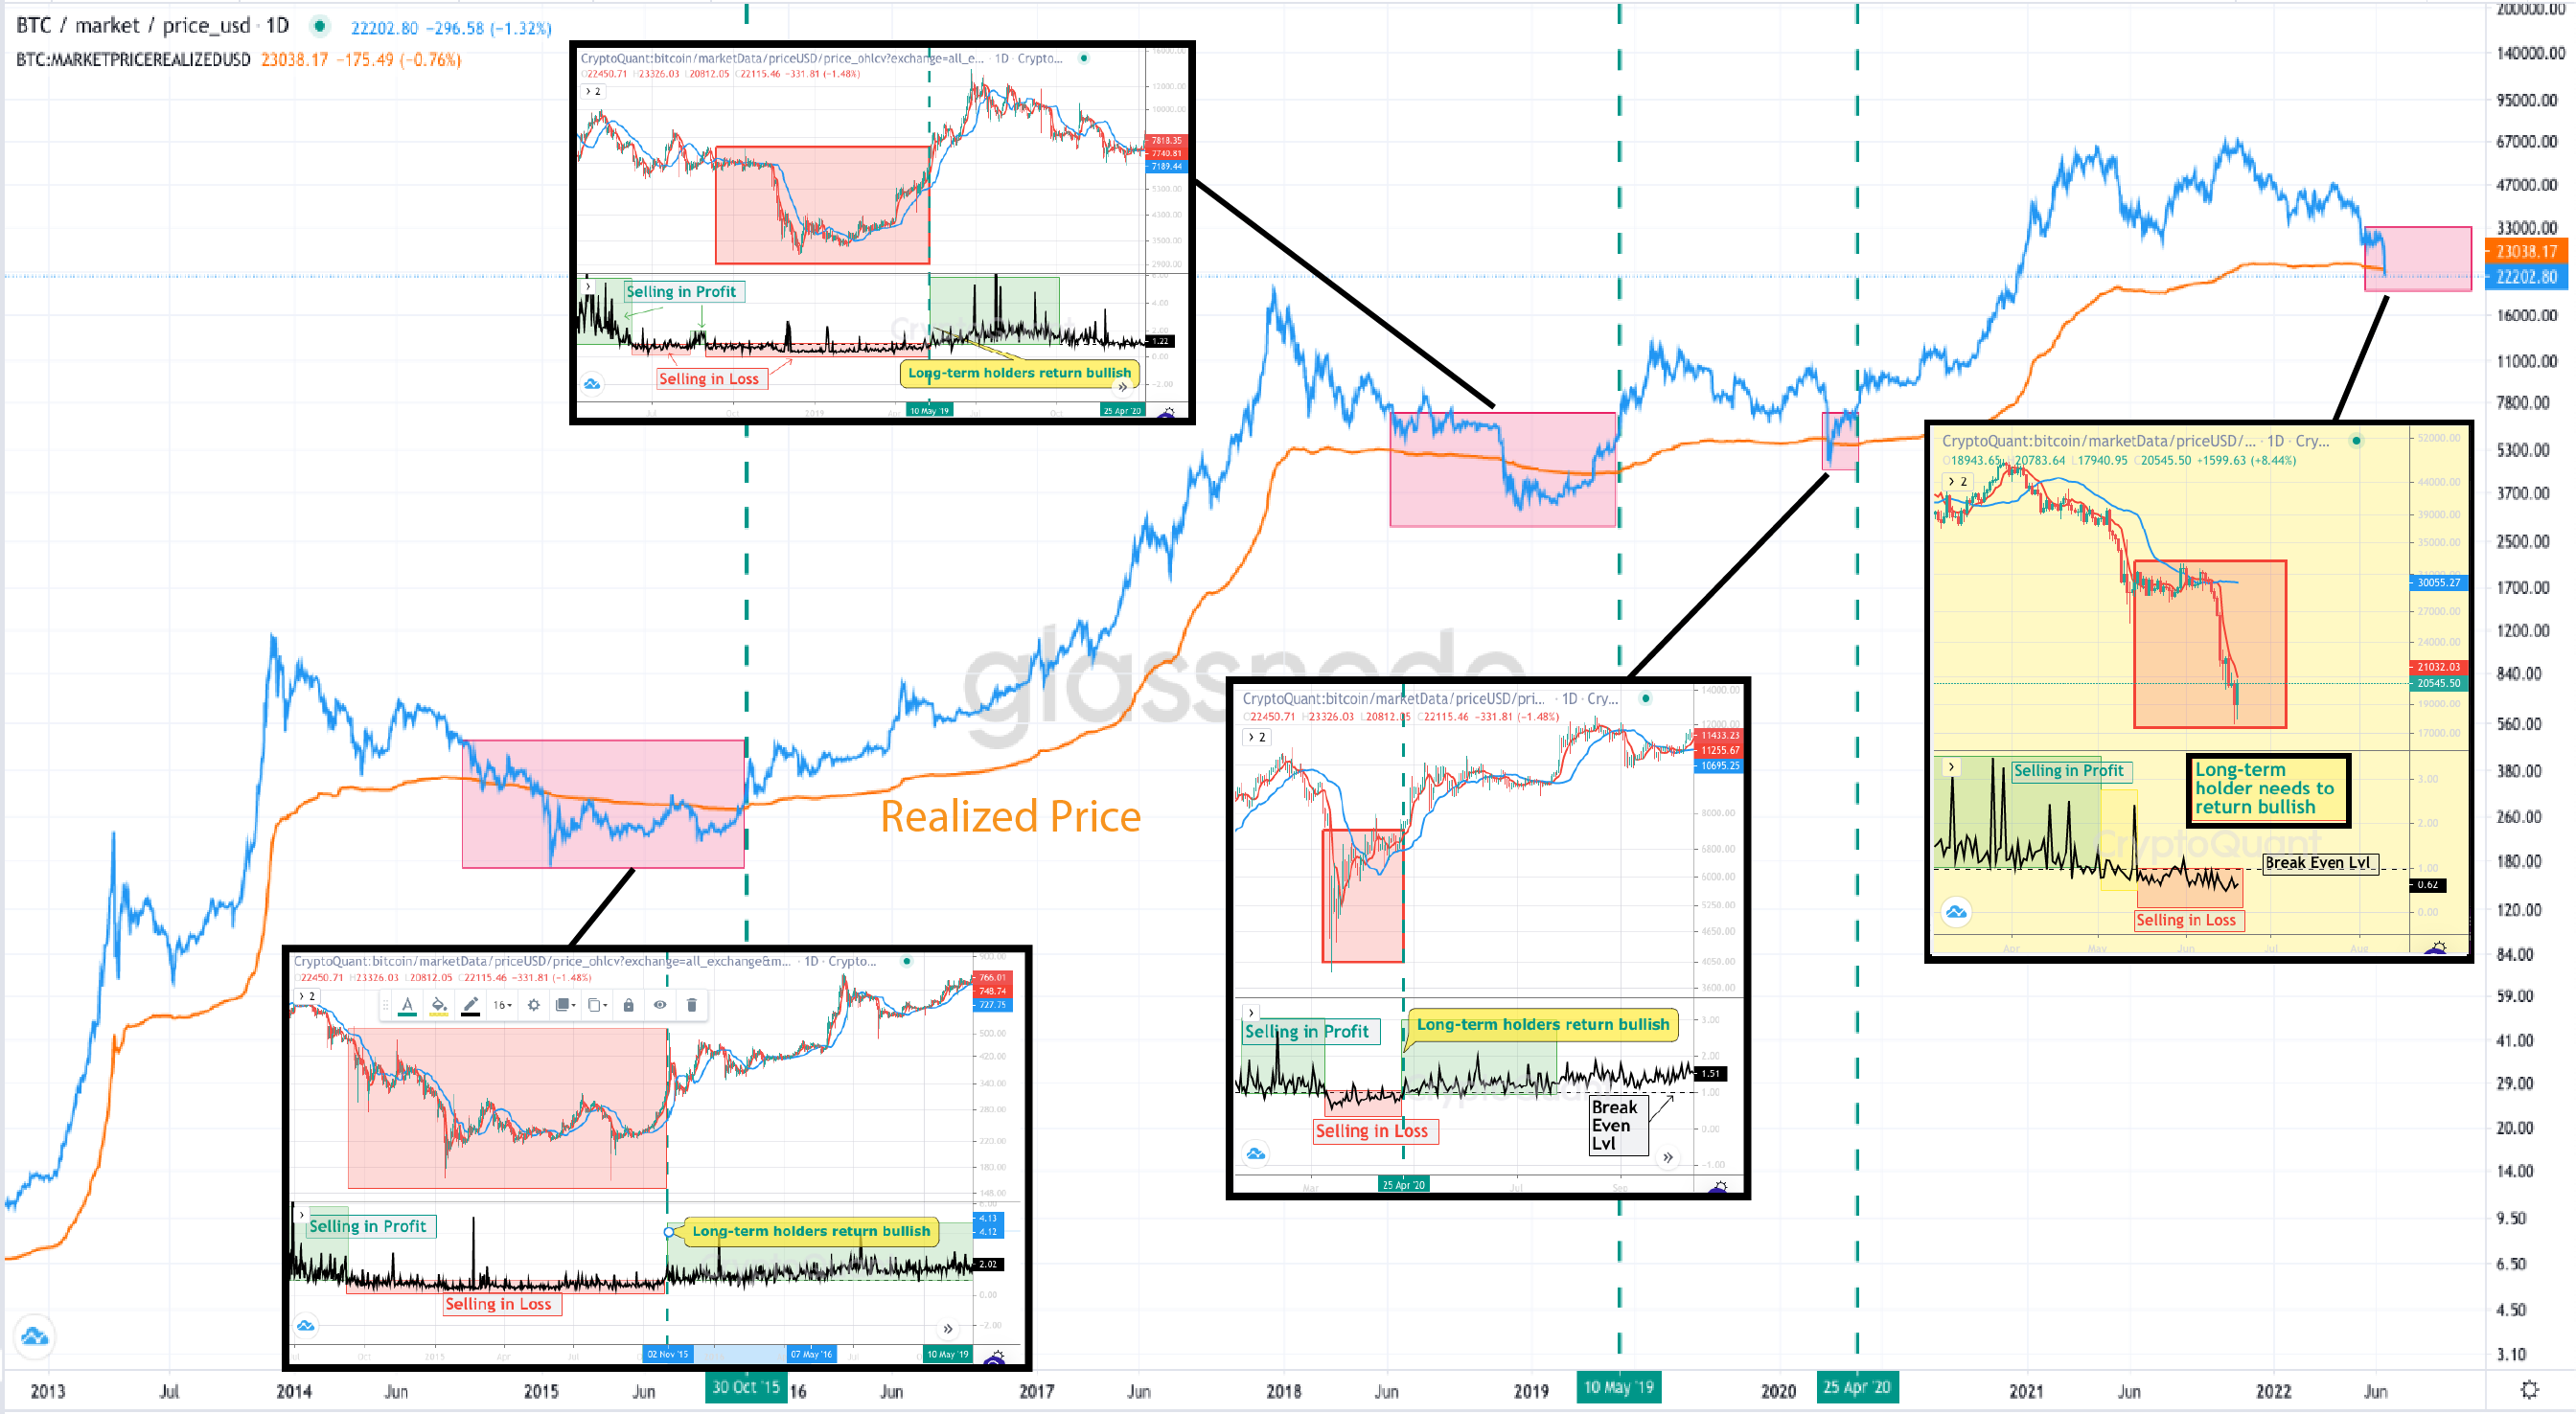
Long-term holders have been capitulating and selling at losses (long-term SOPR < 1). In 2014 and 2018, long-term holders starting to capitulate and to sell at losses both marked the beginning of a prolonged bear market which lasted around one year. The March 2020 Covid crash ended up with a quick V-shape recovery given the Fed’s quantitative easing plans on an unprecedented scale. The bull markets following these three occurrences were all accompanied by long-term holder’s sentiment turning bullish. Currently, no such sign is showing (small chart above with yellow background). Unfortunately, this points to more downward moves and prolonged chop actions at best.
Short-term Holder Selling Pressure Incoming

In the short-term, I think it’s also too soon to call a relief rally. The indicator above is the short-term holder SOPR (above 1 – bullish: traders selling in profits; below 1 – bearish: traders selling in losses). And the red and blue lines on price are the average purchase prices for those who bought in the past week and the past month (excluding past week) respectively.
We are still in the short-term bearish sentiment trend, which means traders are going to sell when the break-even price is hit. As a result, most short-term holder SOPR rejections at 1 are correlated with local price tops. This indicator is getting close to 1 again with the extreme short-term traders holding bitcoins bought at 21k. For a short-term relief rally buy, I would wait for short-term SOPR holding above 1.
Institutions Remain Bearish

USDT dominance is now above 8%, its all-time-high since issuance (unshaken by more than 10billion redemption in the past month given fear of a UST like de-pegging). In other words, investors are hoarding stable coins and haven’t started to use stable coins at hand to enter the market.
Similar bearishness could be observed from the institutional behaviors. With 76% of trading volume contributed by institutional traders in Q1 this year, Coinbase reflects the short-term sentiment of institutional traders. The Coinbase vs. Binance premium has been negative since 38k in early May and is currently still down-trending. This is similar to 2018 market conditions. In both the 2019 3k bottom and the 2020 covid dips, Coinbase was trading at premiums compared to Binance, and such indication of institutional faith gave plenty of buy-the-bottom opportunities. I think waiting patiently till such indications show up would be much better than dollar-cost averaging from the current level, which risks catching a falling knife and stomaching large drawdowns for an extended period.
New Indicators
Below are some new indicators I developed lately.
Institutional Trader Premium Indicator
(Used in the above chart)
https://www.tradingview.com/script/jMnKn8Er-BTC-Coinbase-Premium-Trend/
SOPR Signal

The script uses Glassnode's SOPR on-chain data to identify:
1. Sentiment Trends:
- Green circle on bottom ( Bullish ) -> Investors are selling in profits
- Red circle on top ( Bearish ) -> Investors are selling in losses
2. Short-term Entries:
- Small green circle on SOPR ( Bullish ) -> Approaching investor purchase price in bull run -> not willing to sell -> decrease supply
- Small red circle on SOPR ( Bearish ) -> Approaching break-even price in bear run -> chance to get out -> increase supply
3. Potential Trend Change:
- Yellow circle on top/bottom -> Potential trend changing soon
https://www.tradingview.com/script/nzuHp5az-SOPR-Signal/
Active Address Trend:

This indicator compares the % change in BTC price and the % change in BTC’s active addresses (BTC’s utility value).
1. % changes in BTC price & active addresses
- Orange line: BTC’s price change (%)
- Gray line: BTC’s active address change (%)
- Red/Yellow/Green lines: Bollinger bands for change in active address
2. Trend:
- Green circles: Bullish Sentiment Trend
Market sentiment is bullish and BTC price outgrows the increase in its utility value (overpricing)
- Red circles: Bearish Sentiment Trend
Market sentiment is bearish and BTC price drops more than the decrease in its utility value (underpricing)
3. Potential Re-Entries:
- Green/Red triangles: potential bullish / bearish entries
When % change of BTC price gets similar to that of active addresses
https://www.tradingview.com/script/Czkfui2v-BTC-Active-Address-Trend-On-chain/
Active Address Momentum:

This indicator shows the difference between the % change in BTC price and the % change in BTC’s active addresses (BTC’s utility value).
- Dark red: Extreme overbought conditions
BTC price is increasing too fast and outgrows the increase in its utility value
( RSI of % change difference > 70)
- Light red: Overbought conditions
BTC price is increasing too fast and outgrows the increase in its utility value
( RSI of % change difference > 60)
- Dark green: Extreme oversold conditions
BTC price is dropping too fast and outruns the decrease in its utility value
( RSI of % change difference < 30)
- Light green: Oversold conditions
BTC price is dropping too fast and outruns the decrease in its utility value
( RSI of % change difference < 40 )
Momentum: https://www.tradingview.com/script/KI8h2N33-BTC-Active-Address-Momentum-On-chain/
Other Free Indicator Links:
On-chain Whale Demand:
https://www.tradingview.com/script/9Fhu9LGQ-BTC-Transaction-On-Chain-Volume-Basic/
Alt-coin vs. BTC Season:
https://www.tradingview.com/script/95QlU7Uk-Altcoin-vs-BTC-Season/
Auto MACD Divergences:
https://www.tradingview.com/script/NvtunxPO-MACD-w-Divergences/
Auto RSI Divergences:
https://www.tradingview.com/script/CuB4Dgs0-RSI-w-MAs-Divergences/
Disclaimer
NONE OF THE INFORMATION IS INTENDED AS INVESTMENT ADVICE, AS AN OFFER OR SOLICITATION OF AN OFFER TO BUY OR SELL, OR AS A RECOMMENDATION, ENDORSEMENT, OR SPONSORSHIP OF ANY SECURITY, GROUP, POOL, OR FUND. IT SHOULD NOT BE ASSUMED THAT THE METHODS, TECHNIQUES, OR INDICATORS PRESENTED IN THIS NEWSLETTER WILL BE PROFITABLE OR THAT THEY WILL NOT RESULT IN LOSSES. PAST RESULTS ARE NOT NECESSARILY INDICATIVE OF FUTURE RESULTS. THE CONTENT AND ANALYSIS IN THIS NEWSLETTER IS FOR EDUCATIONAL PURPOSES ONLY AND IS NOT INTENDED TO BE AND DOES NOT CONSTITUTE FINANCIAL ADVICE OR ANY OTHER ADVICE. THE INFORMATION PROVIDED IS GENERAL IN NATURE AND NOT SPECIFIC TO YOU. YOU ARE RESPONSIBLE FOR YOUR OWN INVESTMENT RESEARCH AND INVESTMENT DECISIONS.