

Bottom Forming

Dear subscribers,
Welcome to Bitcoin Onchain, Offchain, and Beyond.
With the futures market boom, evolving Defi protocols, ETFs, and increasing legacy market correlation, the Bitcoin landscape has become much more complex compared to past cycles. This newsletter is aimed to provide insights in this more nuanced landscape. We use both on-chain and off-chain data to capture the spot and derivative market supply and demand dynamics.
Below is a summary for market conditions on April 20th 2022 (current price $41.4k):
Long term/Cycle:
Bullish. Whales have been accumulating below $50k and mega whale holdings have significantly increased since late February. With institutional futures selling pressure now exhausted, BTC is at great long-term accumulation level.
Short term:
Bullish till 44k. While we at long-term oversold levels, the retail demand has not yet started to kick in from either the spot or derivative markets. Such liquidity is needed for us to break key resistance levels. However, tax selling is now behind us, and the next FOMC meeting is still 2 weeks away. With BTC technicals turning bullish in the past 48 hours, and more importantly, not much futures selling pressure, I expect a slow grind up on BTC and some alt runs in the following week or two. Invalidated if BTC breaks below 39k.
Cheers,
Phi
Whale Accumulating
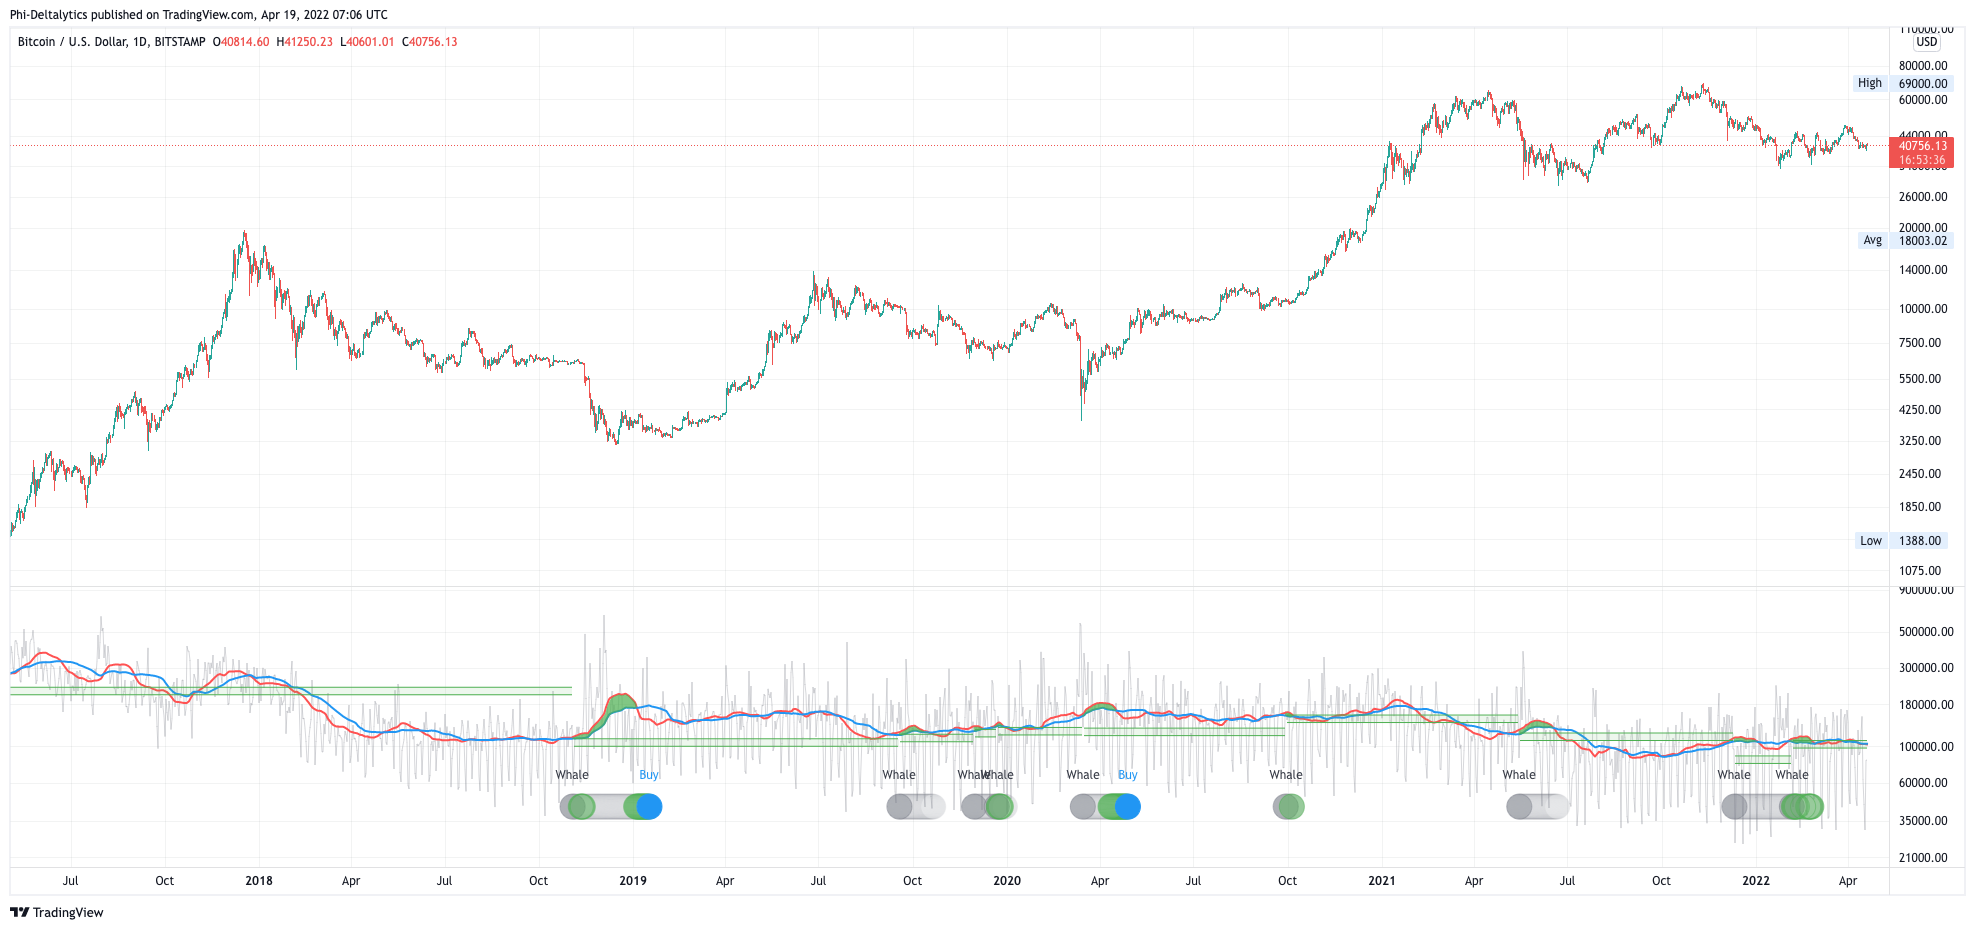
Increased on-chain activities have been spotted, and our on-chain whale market bottom accumulation indicator suggests whales have been accumulating below 50k. Historically, such occurrences yield great spot buying opportunities.

Similarly, mega whale activities have picked up significantly since late February. The chart above is the total number of whale addresses holding more than 1k BTC. In 2021, this group accumulated throughout the run to $50k, and distributed in the $50-60k range before the May bloodbath. In the past 2 weeks, this group have been accumulating despite the price drop from 46k.
Futures Selling Pressure Exhausted
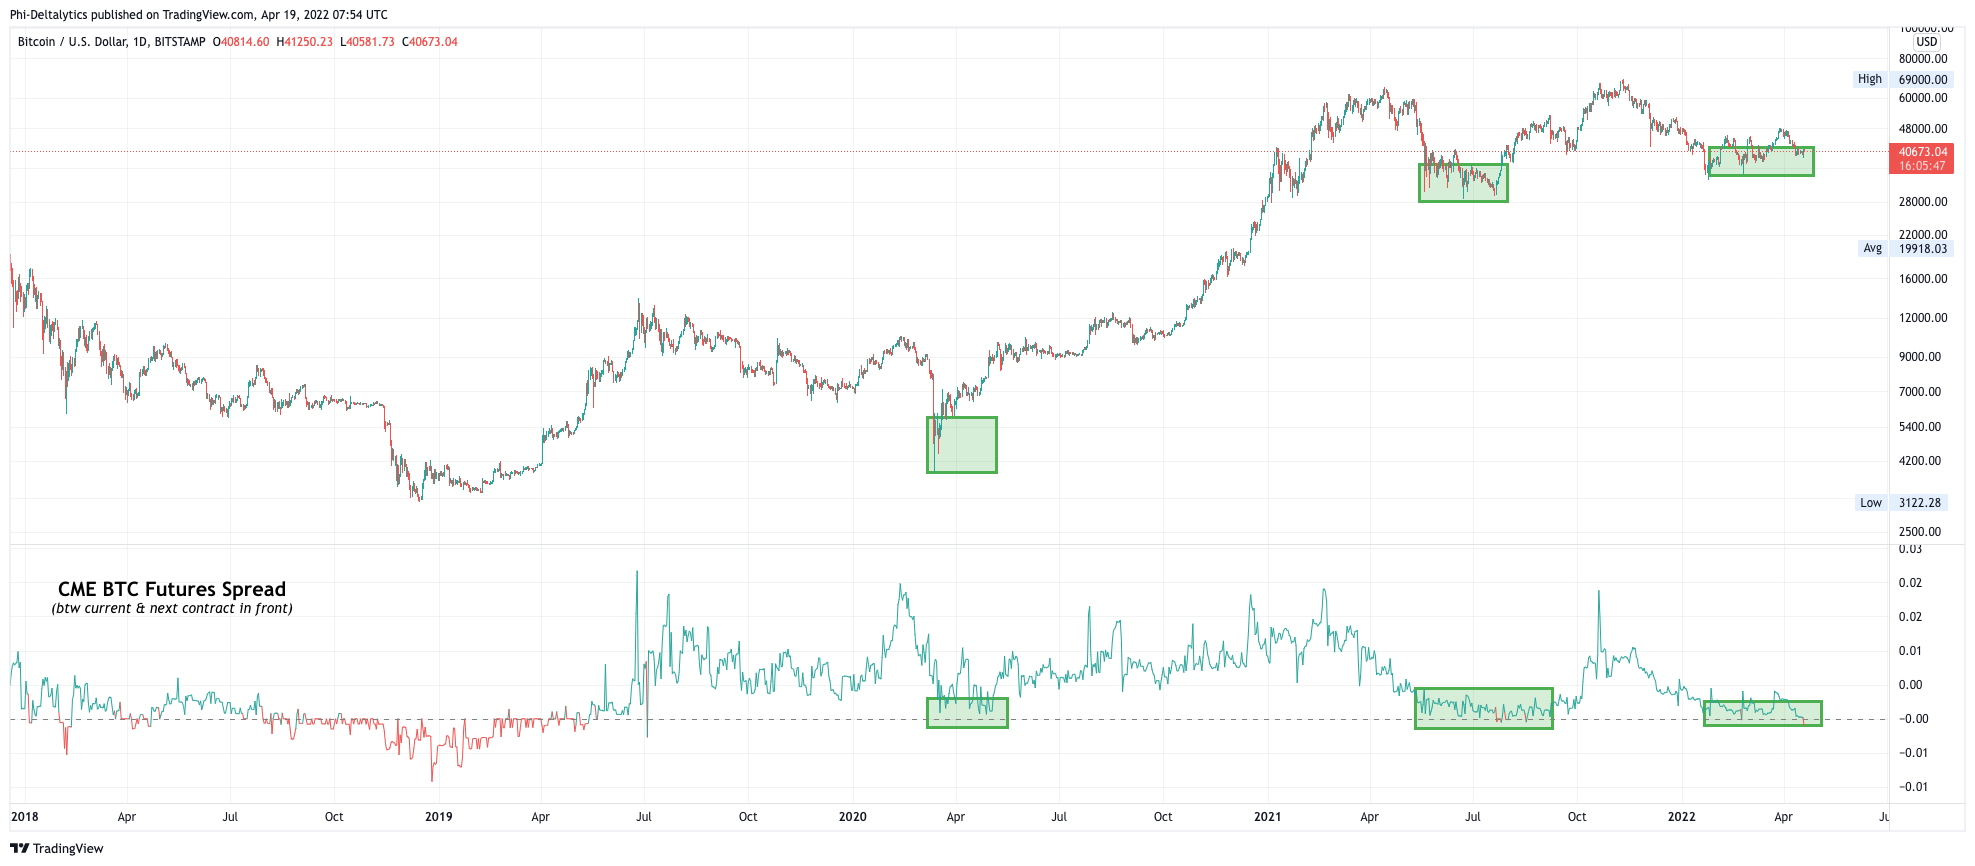
Futures selling pressure has exhausted. The chart above is the CME BTC futures spread. In a bull market, the spread is positive, while in a bear market, the spread is negative. When the spread is high, there’s an incentive for the basis trade arbitrage (short futures, long spot; which at its peak yields 15%+ annual ROI) until the arbitrage opportunity exhausts. With the spread bottoming out and futures selling pressure being the main bearish driver since BTC all-time-high in November last year, bitcoin has a high chance of bouncing up from the current level.
Retail Demand Has Yet to Return
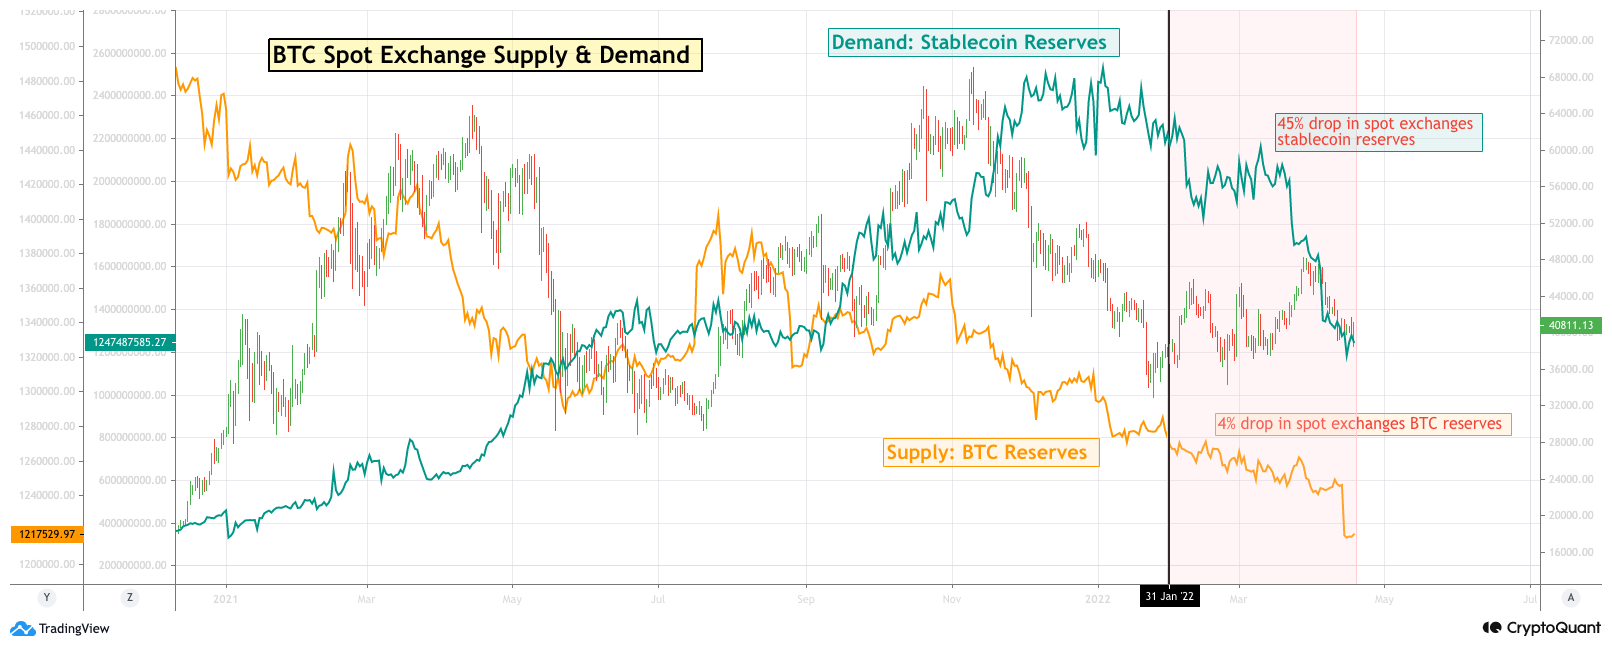
While long-term metrics look rosy, retail demand has not yet returned. The chart above shows the supply and demand dynamics on spot exchanges. Despite the 4% drop in BTC reserve since February, stablecoin reserve on spot exchanges has dropped 45%. Even though the magnitudes of stablecoin inflow/outflows have picked up, reserve has not, which indicates whale but not yet retail involvements. For the liquidity to pick up, retail turning bullish and having enough gun powder to buy is necessary.
Short Term Technicals
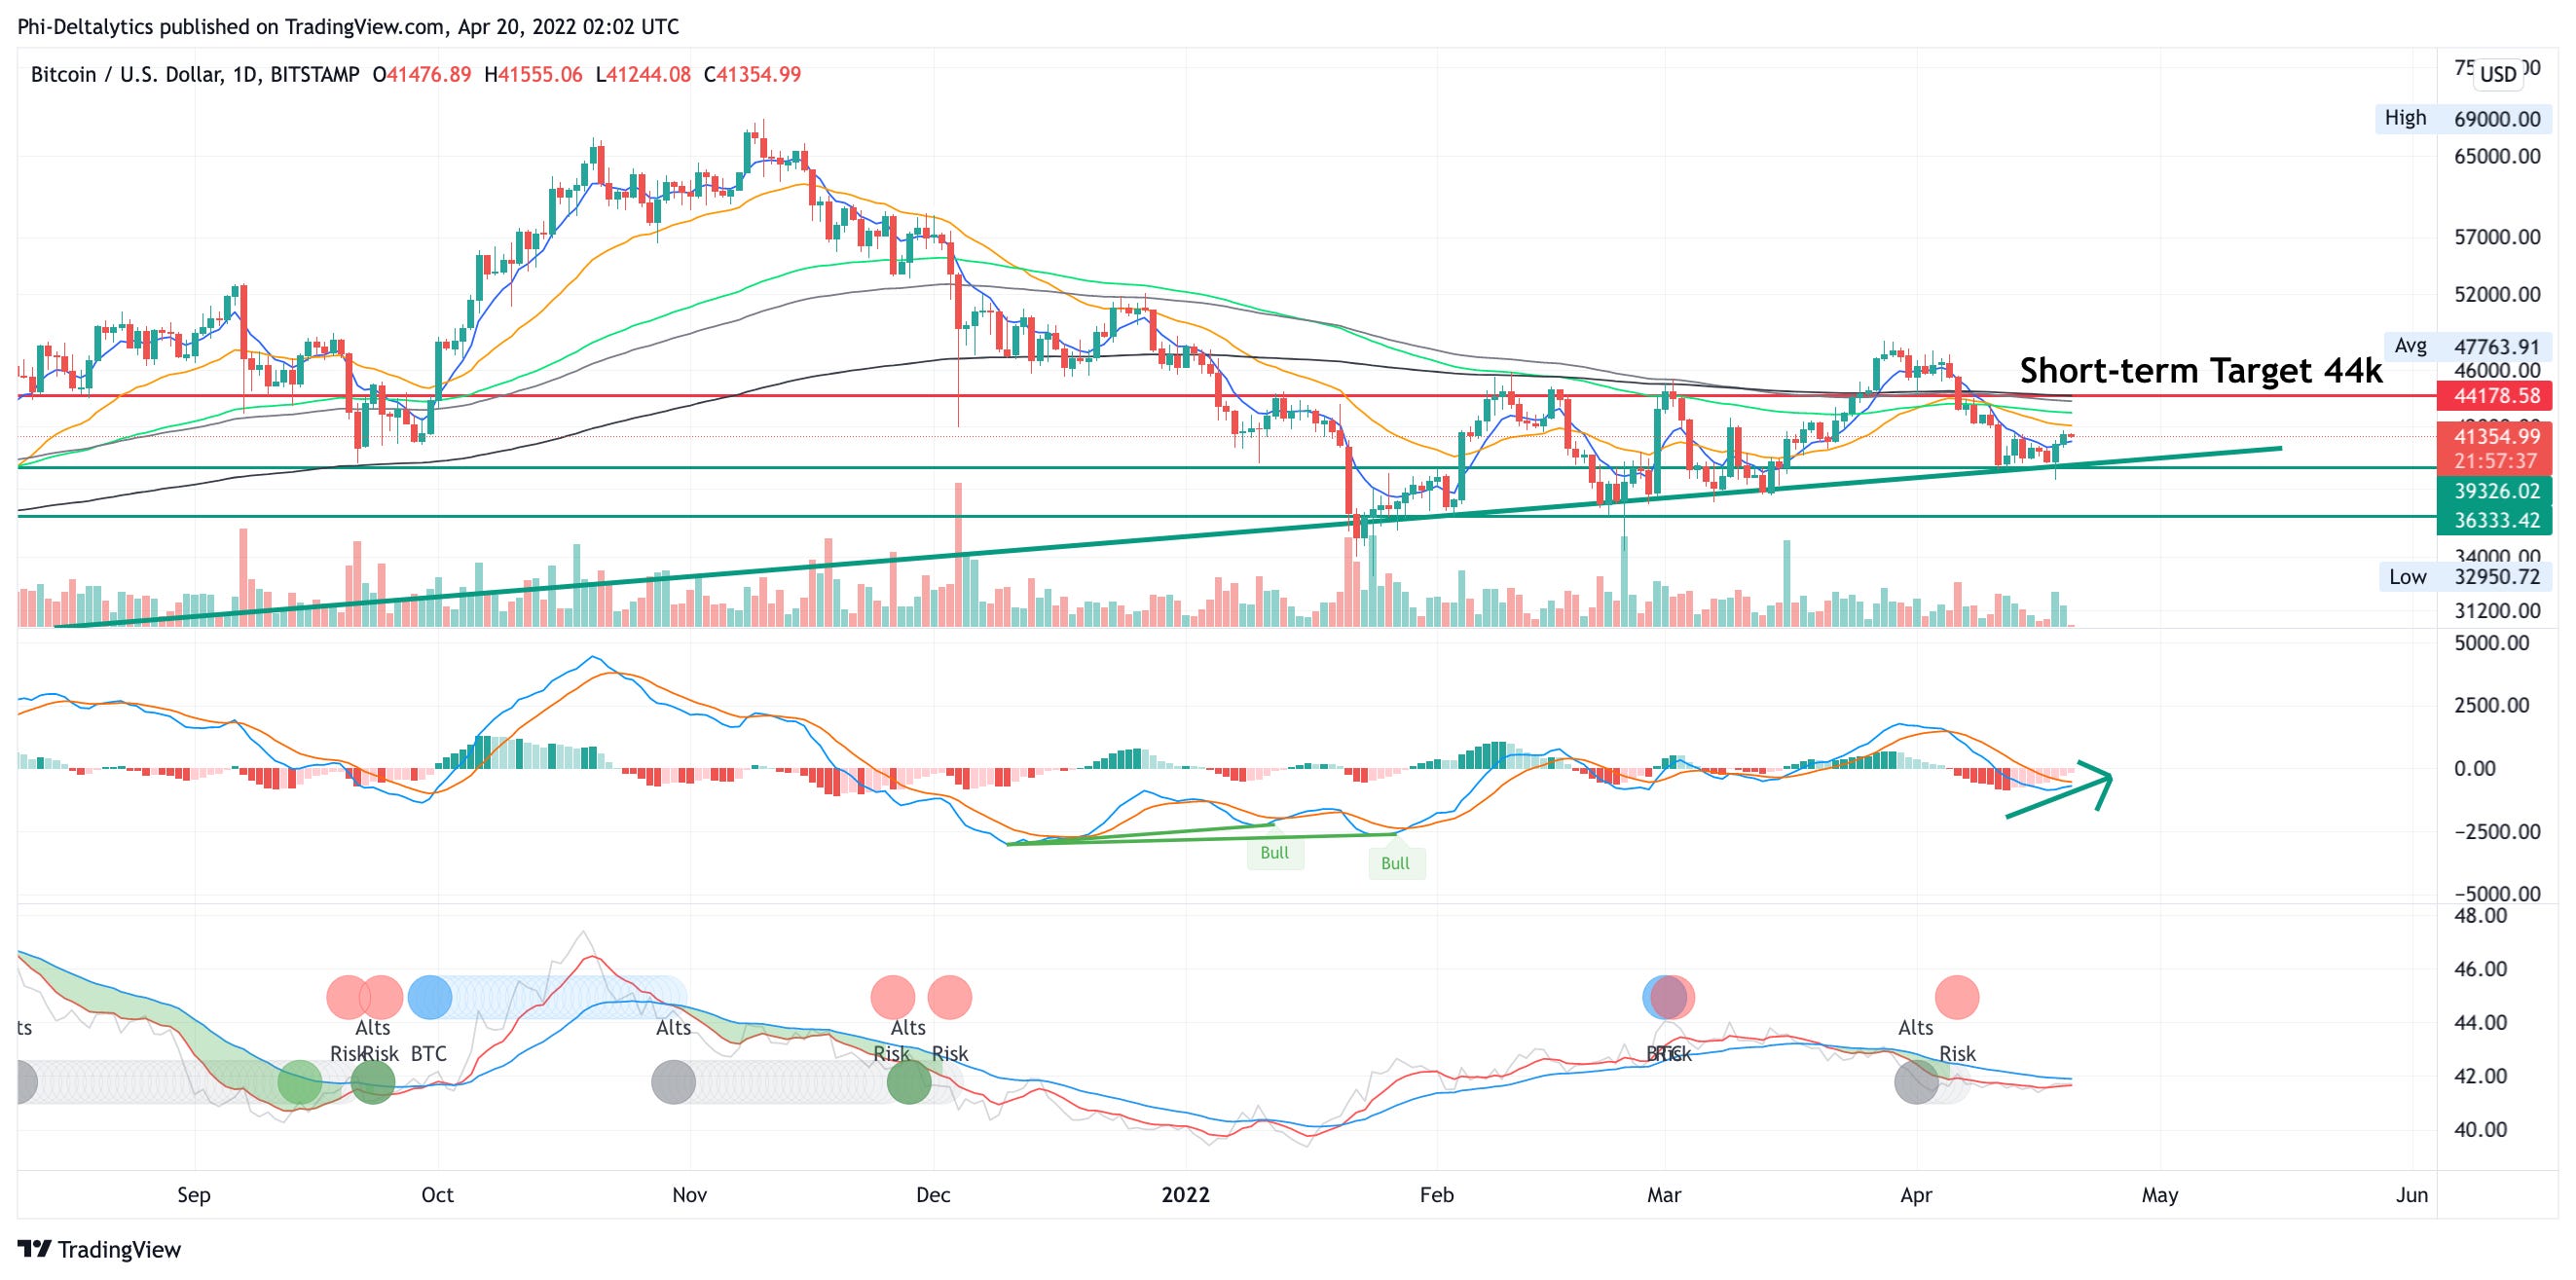
We’ve formed a strong support at 39k and the daily MACD is likely going to up-cross soon. Intraday charts are also looking bullish, which may cascade to the longer term charts soon. With long-term fundamental metrics being bullish and futures selling exhausted, the technicals have a good chance to bring BTC back to at least the 44k level in the coming 2 weeks.
Before retail demand kicks in for BTC, I’m expecting alts to outperform given most are much more oversold in comparison. Here are the ones I’m watching: AVAX, ATOM, FIL, ETC, WAVES, VOXEL.
Free Indicator Links:
Onchain Whale Demand:
https://www.tradingview.com/script/9Fhu9LGQ-BTC-Transaction-On-Chain-Volume-Basic/
Altcoin vs. BTC Season:
https://www.tradingview.com/script/95QlU7Uk-Altcoin-vs-BTC-Season/
Auto MACD Divergences:
https://www.tradingview.com/script/NvtunxPO-MACD-w-Divergences/
Auto RSI Divergences:
https://www.tradingview.com/script/CuB4Dgs0-RSI-w-MAs-Divergences/
Disclaimer
NONE OF THE INFORMATION IS INTENDED AS INVESTMENT ADVICE, AS AN OFFER OR SOLICITATION OF AN OFFER TO BUY OR SELL, OR AS A RECOMMENDATION, ENDORSEMENT, OR SPONSORSHIP OF ANY SECURITY, GROUP, POOL, OR FUND. IT SHOULD NOT BE ASSUMED THAT THE METHODS, TECHNIQUES, OR INDICATORS PRESENTED IN THIS NEWSLETTER WILL BE PROFITABLE OR THAT THEY WILL NOT RESULT IN LOSSES. PAST RESULTS ARE NOT NECESSARILY INDICATIVE OF FUTURE RESULTS. THE CONTENT AND ANALYSIS IN THIS NEWSLETTER IS FOR EDUCATIONAL PURPOSES ONLY AND IS NOT INTENDED TO BE AND DOES NOT CONSTITUTE FINANCIAL ADVICE OR ANY OTHER ADVICE. THE INFORMATION PROVIDED IS GENERAL IN NATURE AND NOT SPECIFIC TO YOU. YOU ARE RESPONSIBLE FOR YOUR OWN INVESTMENT RESEARCH AND INVESTMENT DECISIONS.